Sensitivity Viewer for Result Sets
The Sensitivity Viewer is a charting tool which allows you to see the impact of changes in certain variable categories on individual variables. It is available for projects and sensitivity Result Sets.
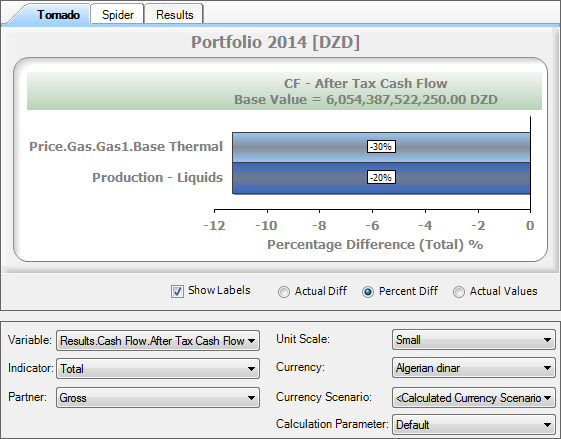
The Sensitivity Viewer window includes the settings area and three tabs for viewing the results: Tornado, Spider and Results.

You can view the results as two different types of charts or plain text. To switch between views, select one of the tabs: Tornado, Spider or Results.
The Tornado tab shows value changes in the bar form. The thickness of the bar does not depend on any values and is selected automatically for better visual presentation. You can edit and save the chart by using its context menu; right-click to open it. The context menu items are described in the following table.
| Item | Description |
|---|---|
| Chart Wizard | Changes chart type and chart display settings. |
| Copy to Clipboard | Copies the image to the clipboard. |
| Edit Colors Option | Changes the colors for groups or variable categories. |
| Export to CSV | Saves the chart as a Comma Separated Values file on your computer. |
| Save Chart as Image | Saves the chart as an image. |
Below the chart you will find additional display options, described in the table below.
| Field | Description |
|---|---|
| Show Labels | Displays or hides percentage labels on the bar which indicate sensitivities. |
| Actual Diff | Displays the difference as the difference of actual values. |
| Percent Diff | Displays the difference as percentage. |
| Actual Values | Displays the actual values. |
The Spider tab contains a different representation of calculated values. You can view the results for different NPV values by selecting them from the list in the Indicator field. The Show Labels, Actual Diff and Percent Diff fields have no functions on this screen.
Note: The spider chart will be displayed if the Result Set contains sensitivities; if only weightings are used, the spider chart will remain blank.
The Results tab shows the precise calculation results as plain text which can be copied. You can view the results for different NPV values by selecting them from the list in the Indicator field. You can also switch between actual and percentage values by selecting the Actual Diff or Percent Diff option. The Show Labels field has no functions on this screen.
The settings area contains general chart settings. See the following table for details.
| Field | Description |
|---|---|
| Variable | Variable(s), the impact on which you want to analyze. Variables are selected when you calculate the Result Set. |
| Indicator | List of indicators and discount rates taken from the Calculation Parameters document selected in the Calculation Parameter field. |
| Partner | Company whose share you want to analyze. Partners are selected when you calculate the Result Set. If you have not calculated any partners, this list will show only the Gross option. |
| Unit Scale | Unit scale of the chart. This setting can be changed on the fly. |
| Currency | Currency of the chart. This setting can be changed on the fly. |
| Currency Scenario | Currency scenario of the chart. This setting can be changed on the fly. |
| Calculation Parameter | Calculation Parameters document from which the discount rates will be taken. The discount rates are used for indicators (selected in the Indicator field). |